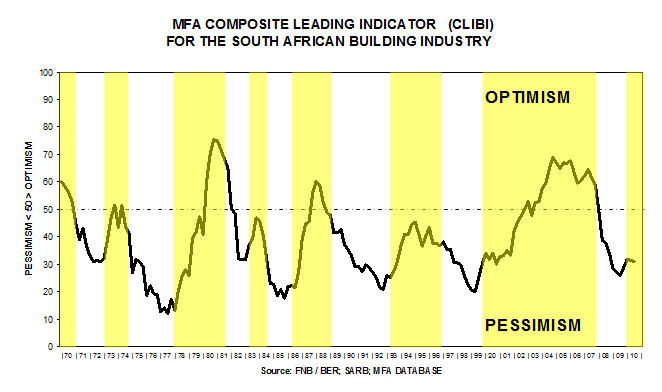
The MFA Composite Leading Indicator for the South African Building Industry (CLIBI) recorded a peak of 69 in late 2004. The index dropped to 26 in 2009, reflecting a lower turning point. This building indicator rose to 32 in the first quarter of 2010. However, it dropped slightly to 31 during the second quarter. It moved virtually sideways during the third quarter of 2010. This is a reflection that survey respondents generally perceive business conditions to be pessimistic (the shaded areas represent the economic upswing phases). Please refer to the graph below.
Components of CLIBI
This unique indicator is based on 24 business survey variables that include the confidence levels of building contractors and sub-contractors, their workloads, employment and profitability trends, the availability of labour and materials and the degree of competition in tendering. It therefore captures the fortunes of the building industry in a nutshell. This survey was conducted in Aug / Sep 2010 amongst building contractors and sub-contractors.