
Stats SA Building Statistics July 2011
Â
Â
Â
Â
Â
Â
Â
Â
Â
Â
Â
Â
Â
Â
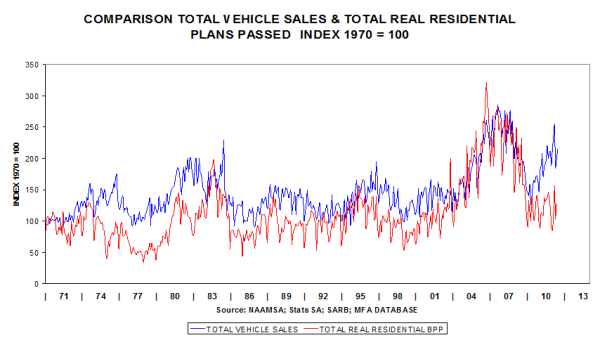
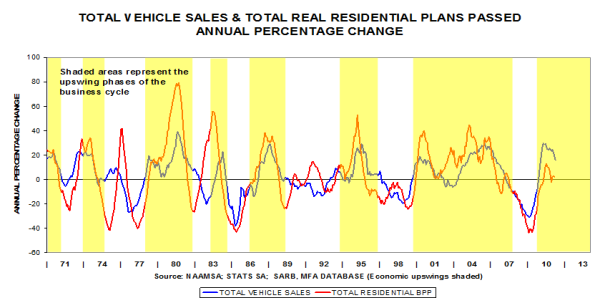
Vehicle sales show a V-shaped recovery, with a U-shaped revival in the case of residential buildings.
Â
The trend in the cyclical movements correspond closely; vehicle sales are about 16% higher than a year ago, with residential only 2% higher. This indicates a much weaker revival in the case of dwelling houses, flats and townhouses.
Â
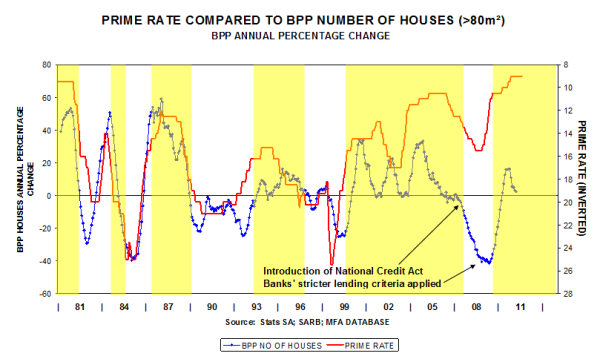
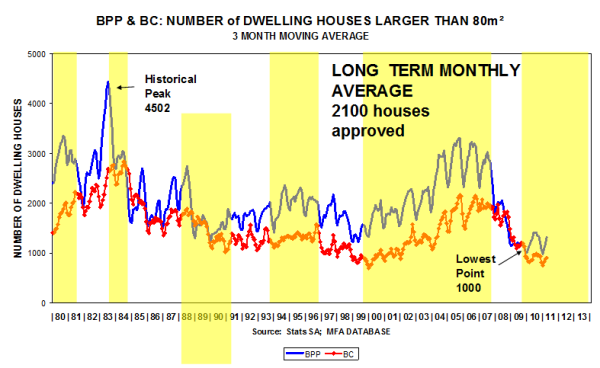
Two blows struck the private housing industry in 2007/08 and the recession was severe. The year-on-year improvement in the annual percentage change of the number of houses (left-hand scale) is currently only 2.4%, pointing to a modest revival.
Â
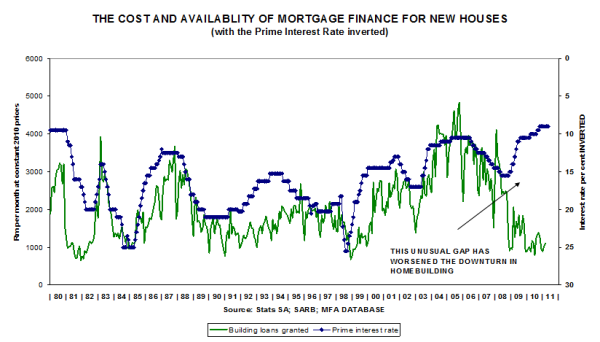
The mortgage rate is an important factor influencing the demand for housing. In the past, lower interest rates have boosted housing demand levels. During the current cycle, lower interest rates had little positive effect.
Â
The availability of housing finance was curtailed by the National Credit Act that was implemented in July 2007.
Â
In terms of numbers, private housing plans approved are slowly improving.
Â
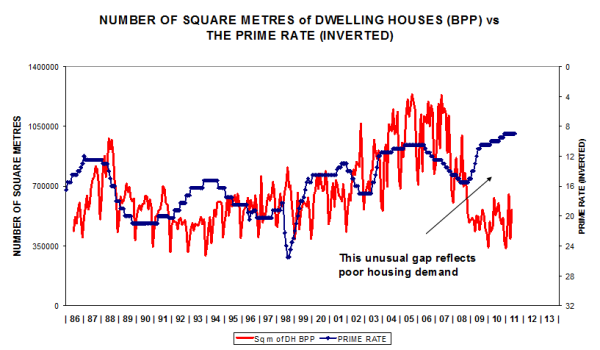
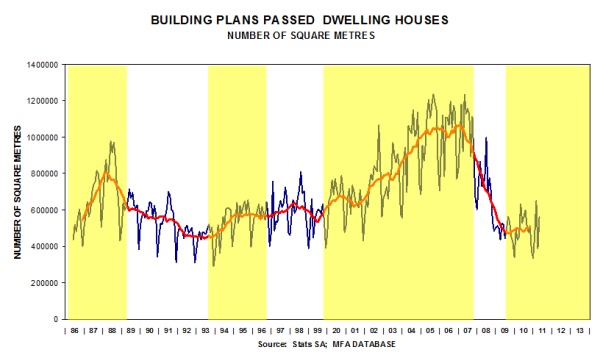
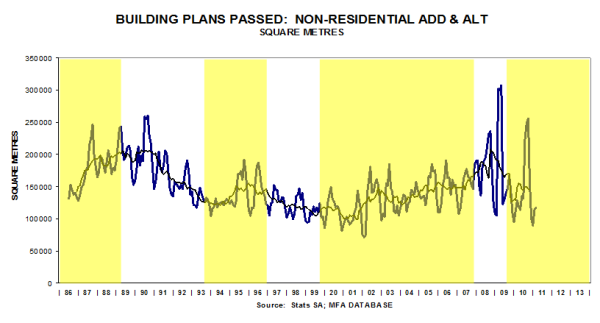
In terms of square metres, dwelling houses are bottoming out, another indication of a modest U-shaped revival.
Â
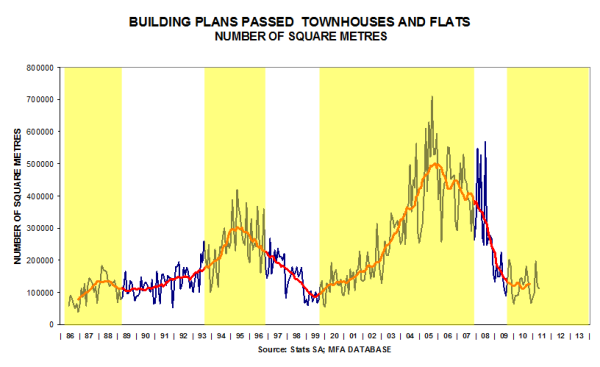
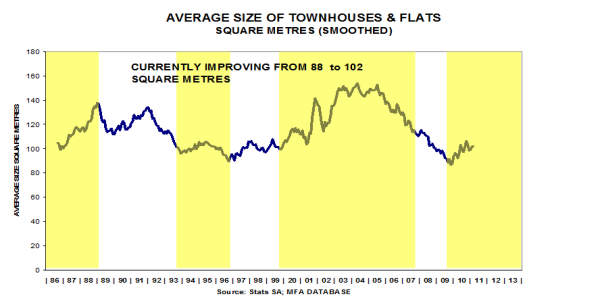
Data of townhouses and flats also show signs of a modest U-shaped revival.
Â
There seems to be a gradual improvement in the sizes of townhouses and flats.
Â
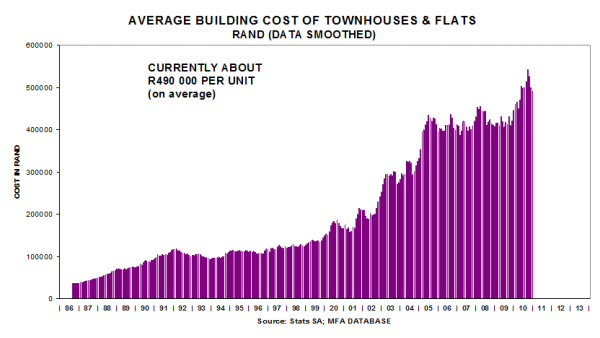
The building cost of townhouses and flats is currently about R500 000 per unit.
Â
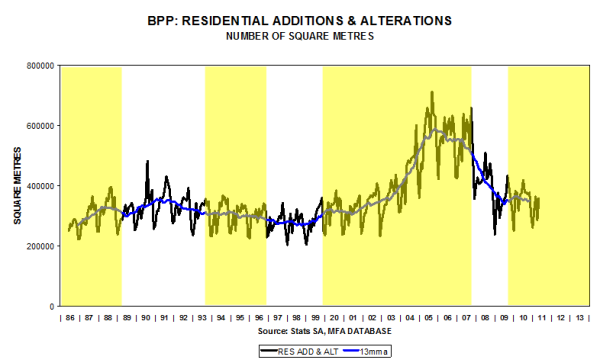
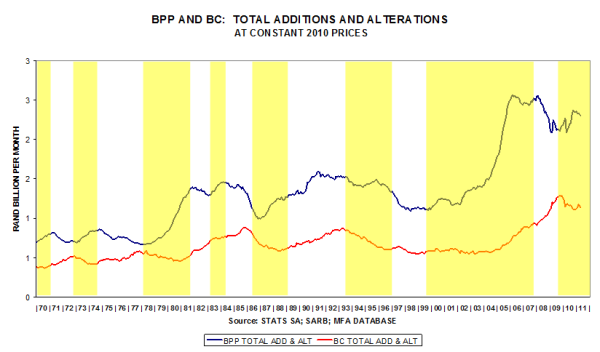
A sideways trend is evident in the case of residential renovations data.
Â
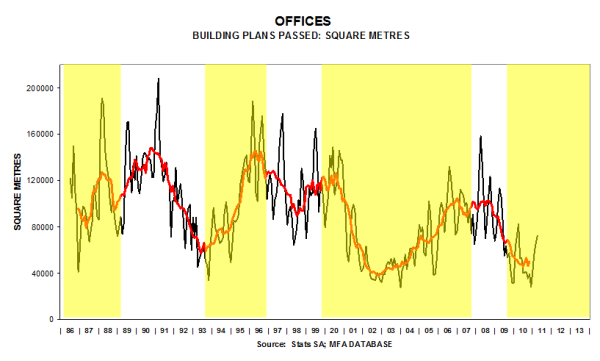
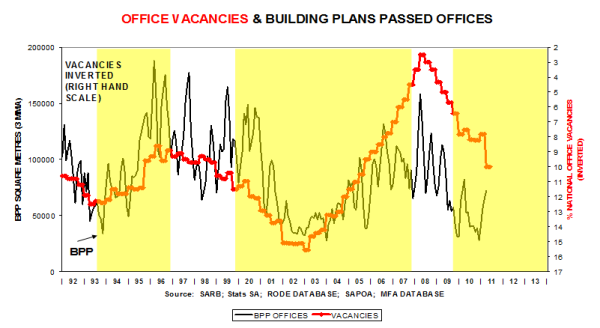
Could the lower turning point in offices already have been recorded?
Â
Despite higher office vacancy levels? (vacancies line inverted)
Â
After the boost provided by two shopping malls (recorded in Jan 2011 data), April and May 2011 data were poor.
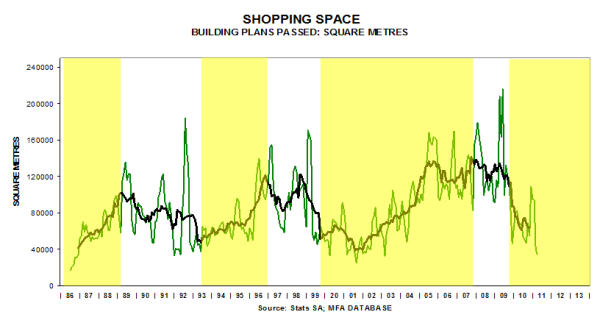
Â
Could the better May 2011 data be signalling a lower turning point?
Â
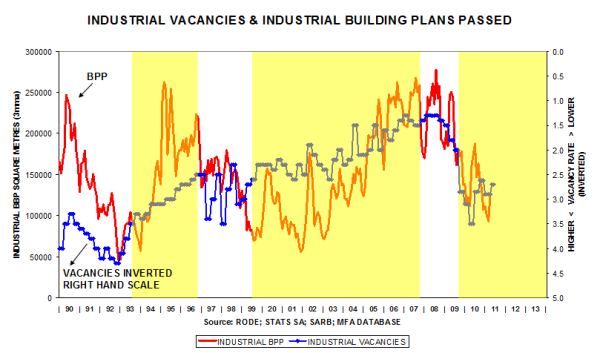
Nevertheless, industrial vacancies remain relatively high (vacancies line inverted).
Â
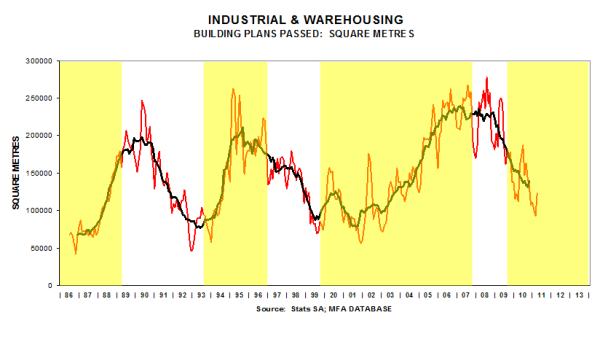
Could the better May 2011 data be signalling a lower turning point?
Â
Further evidence of a modest U-shaped revival.
Â
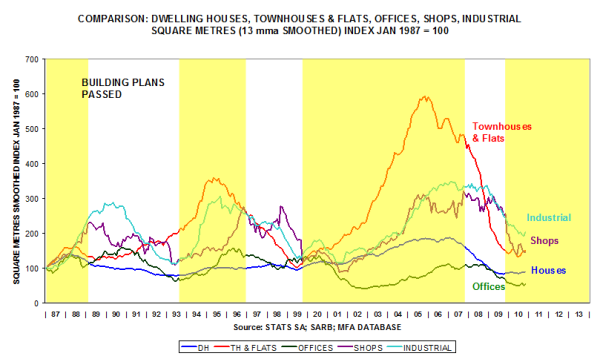
This comparison shows the relative performance of the various market segments since 1987. Long-term trends in houses, flats & townhouses and the industrial sector are showing signs of bottoming out.
Â
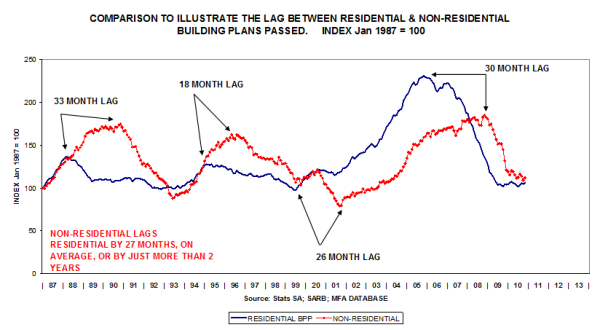
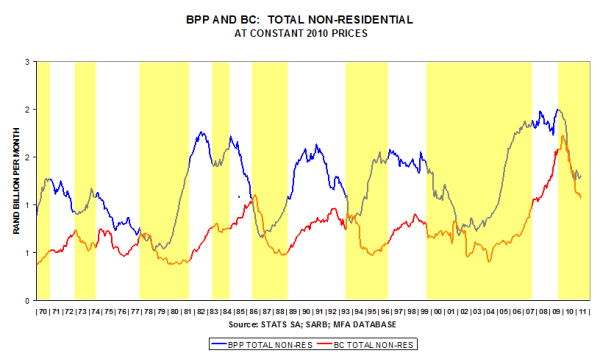
This comparison of long term trends shows the lagged pattern (residential is forming a trough, whilst it is likely that non-residential has further to fall, based on previous cyclical fluctuations).
Â
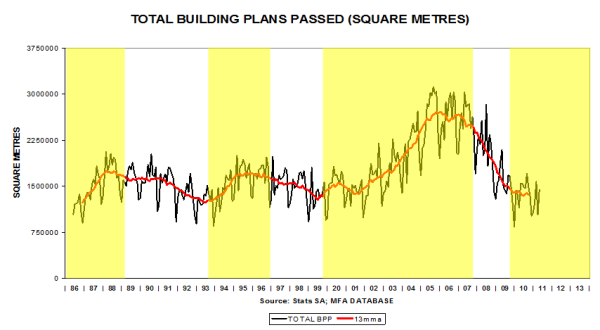
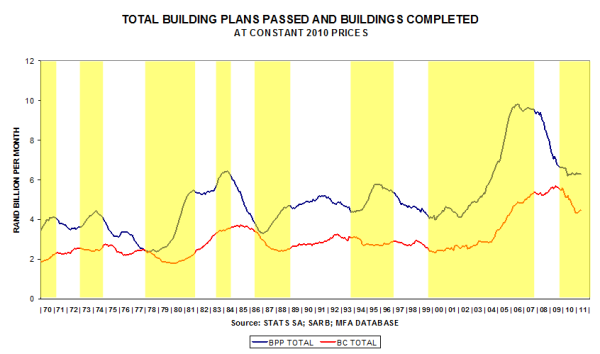
Building Plans Passed is bottoming out, but the lagging Buildings Completed time series is still tending downward.

Â
Both indicators could fall further.
Â
A haphazard sideways movement is evident (no clear trend).
Â
BPP and BC seem to be in the initial stages of forming a trough.
Â